ec2에서 cloudwatch agent를 설치하여 모니터링을 해보겠습니다.
1. IAM 롤 추가/생성
먼저 기존에 없다면 IAM 롤을 생성하시고
기존에 있다면 IAM 롤을 추가하시면 됩니다.
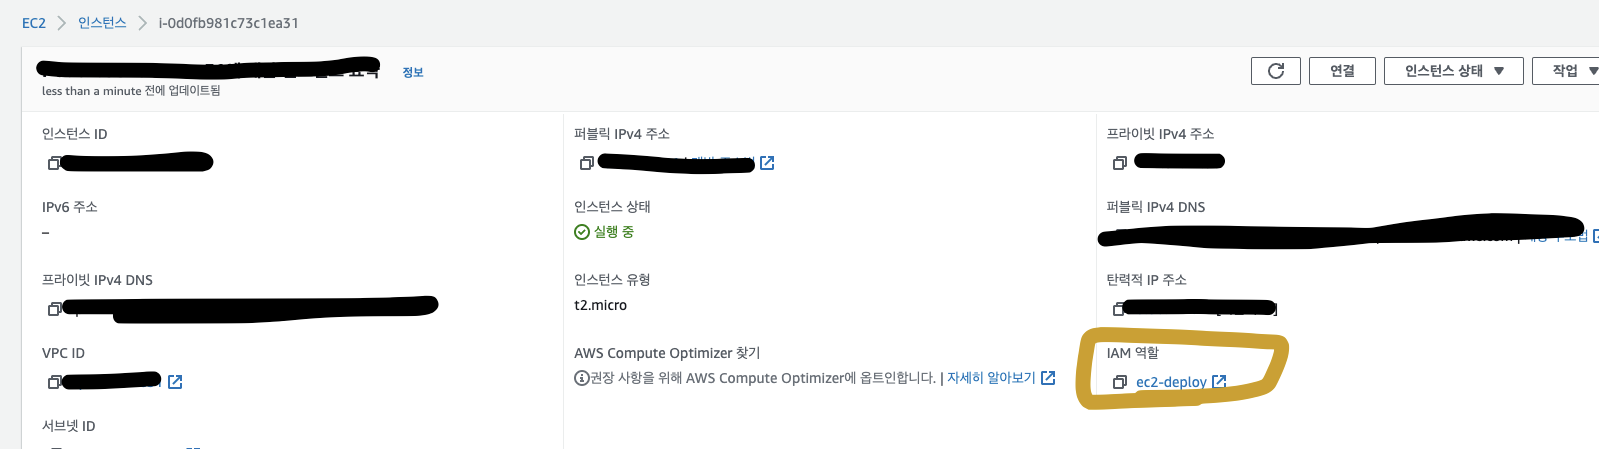
저는 기존에 있기때문에 추가했습니다.
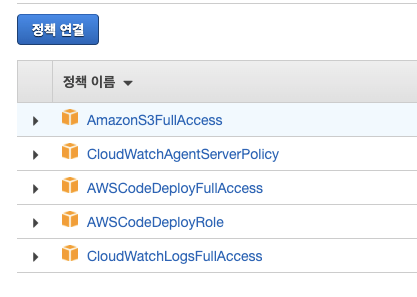
위 사진의 IAM에 들어가서 정책연결을 통해서
CloudWatchAgentServerPolicy를 추가해줍니다.
2. ec2에 들어가서 cloudwatch Agent 설치
저는 amazon linux2입니다.
$ wget https://s3.amazonaws.com/amazoncloudwatch-agent/amazon_linux/amd64/latest/amazon-cloudwatch-agent.rpm
$ sudo rpm -U ./amazon-cloudwatch-agent.rpm
다음에 config.json을 생성해줘야 합니다.
$ sudo /opt/aws/amazon-cloudwatch-agent/bin/amazon-cloudwatch-agent-config-wizard위의 코드를 작성하면 아래와 같은 문구가 나옵니다.
=============================================================
= Welcome to the AWS CloudWatch Agent Configuration Manager =
=============================================================
On which OS are you planning to use the agent?
1. linux
2. windows
3. darwin
default choice: [1]:

Trying to fetch the default region based on ec2 metadata...
Are you using EC2 or On-Premises hosts?
1. EC2
2. On-Premises
default choice: [1]:

Which user are you planning to run the agent?
1. root
2. cwagent
3. others
default choice: [1]:

Do you want to turn on StatsD daemon?
1. yes
2. no
default choice: [1]:

Which port do you want StatsD daemon to listen to?
default choice: [8125]

What is the collect interval for StatsD daemon?
1. 10s
2. 30s
3. 60s
default choice: [1]:

What is the aggregation interval for metrics collected by StatsD daemon?
1. Do not aggregate
2. 10s
3. 30s
4. 60s
default choice: [4]:

Do you want to monitor metrics from CollectD?
1. yes
2. no
default choice: [1]:

Do you want to monitor any host metrics? e.g. CPU, memory, etc.
1. yes
2. no
default choice: [1]:

Do you want to monitor cpu metrics per core? Additional CloudWatch charges may apply.
1. yes
2. no
default choice: [1]:
2
Do you want to add ec2 dimensions (ImageId, InstanceId, InstanceType, AutoScalingGroupName) into all of your metrics if the info is available?
1. yes
2. no
default choice: [1]:

Would you like to collect your metrics at high resolution (sub-minute resolution)? This enables sub-minute resolution for all metrics, but you can customize for specific metrics in the output json file.
1. 1s
2. 10s
3. 30s
4. 60s
default choice: [4]:

Which default metrics config do you want?
1. Basic
2. Standard
3. Advanced
4. None
default choice: [1]:
3
Current config as follows:
{
	"agent": {
		"metrics_collection_interval": 60,
		"run_as_user": "root"
	},
	"metrics": {
		"append_dimensions": {
			"AutoScalingGroupName": "${aws:AutoScalingGroupName}",
			"ImageId": "${aws:ImageId}",
			"InstanceId": "${aws:InstanceId}",
			"InstanceType": "${aws:InstanceType}"
		},
		"metrics_collected": {
			"collectd": {
				"metrics_aggregation_interval": 60
			},
			"cpu": {
				"measurement": [
					"cpu_usage_idle",
					"cpu_usage_iowait",
					"cpu_usage_user",
					"cpu_usage_system"
				],
				"metrics_collection_interval": 60,
				"totalcpu": false
			},
			"disk": {
				"measurement": [
					"used_percent",
					"inodes_free"
				],
				"metrics_collection_interval": 60,
				"resources": [
					"*"
				]
			},
			"diskio": {
				"measurement": [
					"io_time",
					"write_bytes",
					"read_bytes",
					"writes",
					"reads"
				],
				"metrics_collection_interval": 60,
				"resources": [
					"*"
				]
			},
			"mem": {
				"measurement": [
					"mem_used_percent"
				],
				"metrics_collection_interval": 60
			},
			"netstat": {
				"measurement": [
					"tcp_established",
					"tcp_time_wait"
				],
				"metrics_collection_interval": 60
			},
			"statsd": {
				"metrics_aggregation_interval": 60,
				"metrics_collection_interval": 10,
				"service_address": ":8125"
			},
			"swap": {
				"measurement": [
					"swap_used_percent"
				],
				"metrics_collection_interval": 60
			}
		}
	}
}
Are you satisfied with the above config? Note: it can be manually customized after the wizard completes to add additional items.
1. yes
2. no
default choice: [1]:

Do you have any existing CloudWatch Log Agent (http://docs.aws.amazon.com/AmazonCloudWatch/latest/logs/AgentReference.html) configuration file to import for migration?
1. yes
2. no
default choice: [2]:

Do you want to monitor any log files?
1. yes
2. no
default choice: [1]:
/ var/log/messages
The value var/log/messages is not valid to this question.
Please retry to answer:
Do you want to monitor any log files?
1. yes
2. no
default choice: [1]:

Log file path:
/var/log/messages
Log group name:
default choice: [messages]

Log stream name:
default choice: [{instance_id}]

Do you want to specify any additional log files to monitor?
1. yes
2. no
default choice: [1]:

Log file path:
/var/log/secure
Log group name:
default choice: [secure]

Log stream name:
default choice: [{instance_id}]

Do you want to specify any additional log files to monitor?
1. yes
2. no
default choice: [1]:

Log file path:
~/deploy/logs
Log group name:
default choice: [logs]

Log stream name:
default choice: [{instance_id}]

Do you want to specify any additional log files to monitor?
1. yes
2. no
default choice: [1]:
2
Saved config file to /opt/aws/amazon-cloudwatch-agent/bin/config.json successfully.
Current config as follows:
{
	"agent": {
		"metrics_collection_interval": 60,
		"run_as_user": "root"
	},
	"logs": {
		"logs_collected": {
			"files": {
				"collect_list": [
					{
						"file_path": "/var/log/messages",
						"log_group_name": "messages",
						"log_stream_name": "{instance_id}"
					},
					{
						"file_path": "/var/log/secure",
						"log_group_name": "secure",
						"log_stream_name": "{instance_id}"
					},
					{
						"file_path": "~/deploy/logs",
						"log_group_name": "logs",
						"log_stream_name": "{instance_id}"
					}
				]
			}
		}
	},
	"metrics": {
		"append_dimensions": {
			"AutoScalingGroupName": "${aws:AutoScalingGroupName}",
			"ImageId": "${aws:ImageId}",
			"InstanceId": "${aws:InstanceId}",
			"InstanceType": "${aws:InstanceType}"
		},
		"metrics_collected": {
			"collectd": {
				"metrics_aggregation_interval": 60
			},
			"cpu": {
				"measurement": [
					"cpu_usage_idle",
					"cpu_usage_iowait",
					"cpu_usage_user",
					"cpu_usage_system"
				],
				"metrics_collection_interval": 60,
				"totalcpu": false
			},
			"disk": {
				"measurement": [
					"used_percent",
					"inodes_free"
				],
				"metrics_collection_interval": 60,
				"resources": [
					"*"
				]
			},
			"diskio": {
				"measurement": [
					"io_time",
					"write_bytes",
					"read_bytes",
					"writes",
					"reads"
				],
				"metrics_collection_interval": 60,
				"resources": [
					"*"
				]
			},
			"mem": {
				"measurement": [
					"mem_used_percent"
				],
				"metrics_collection_interval": 60
			},
			"netstat": {
				"measurement": [
					"tcp_established",
					"tcp_time_wait"
				],
				"metrics_collection_interval": 60
			},
			"statsd": {
				"metrics_aggregation_interval": 60,
				"metrics_collection_interval": 10,
				"service_address": ":8125"
			},
			"swap": {
				"measurement": [
					"swap_used_percent"
				],
				"metrics_collection_interval": 60
			}
		}
	}
}
Please check the above content of the config.
The config file is also located at /opt/aws/amazon-cloudwatch-agent/bin/config.json.
Edit it manually if needed.
Do you want to store the config in the SSM parameter store?
1. yes
2. no
default choice: [1]:
2
Program exits now.
$ sudo /opt/aws/amazon-cloudwatch-agent/bin/amazon-cloudwatch-agent-ctl -a fetch-config -m ec2 -c file:/opt/aws/amazon-cloudwatch-agent/bin/config.json -s
config.json 을 작성한것을 위의 코드로 적용시켜줍니다.
하지만...
처음에 이렇게 하면 애러가 납니다.
Error parsing /opt/aws/amazon-cloudwatch-agent/etc/amazon-cloudwatch-agent.toml, open /usr/share/collectd/types.db: no such file or directory그러면 아래의 코드로 types.db파일을 생성해주면 됩니다.
$ mkdir /usr/share/collectd
$ cd /usr/share/collectd
$ touch types.db
.....json -s로 적용시켜 줍니다.
3. cloudwatch를 확인합니다.
지표 -> 모든지표 를 가시면

위와 같이 생깁니다. 여기서 활동 내역들을 볼 수 있습니다.
로그 -> 로그 그룹

config.json을 작성하면서 써줬던 로그들을 볼 수 있습니다.

하지만 기본 로그(messages, secure)들은 나오지만 저의 프로젝트 로그는 나오지가 않네요...
이부분은 해결해서 글을 써보도록 하겠습니다.
'aws' 카테고리의 다른 글
| 탄력적 IP (0) | 2021.10.17 |
|---|---|
| RDS 의 한글설정과 timezone 설정 (0) | 2021.10.10 |